Blog
Should Vettel be considered an F1 great and was...
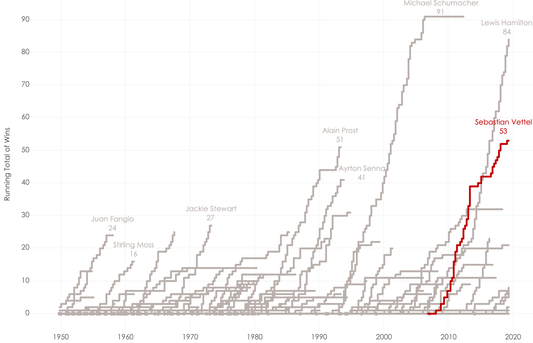
A visual analysis of Sebastian Vettel’s career in numbers and charts. “Numero uno is back, Ferrari is back.” Sebastian Vettel had just won the 2015 Malaysian Grand Prix, his second...
Should Vettel be considered an F1 great and was...
A visual analysis of Sebastian Vettel’s career in numbers and charts. “Numero uno is back, Ferrari is back.” Sebastian Vettel had just won the 2015 Malaysian Grand Prix, his second...
Don't Verstappen Me Now! Using data visualizati...
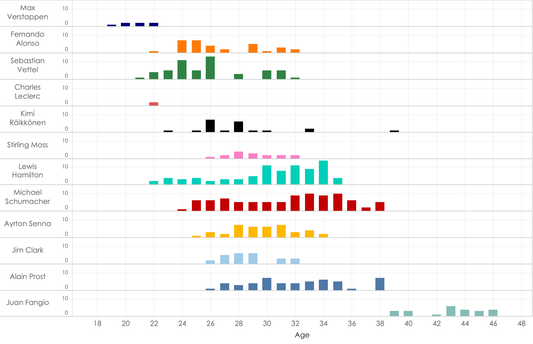
The recent US Grand Prix marked 100 races (or in certain corners of sports parlance, a century) for Max Verstappen. At the tender age of 22, this is quite an...
Don't Verstappen Me Now! Using data visualizati...
The recent US Grand Prix marked 100 races (or in certain corners of sports parlance, a century) for Max Verstappen. At the tender age of 22, this is quite an...
History of F1 World Champions
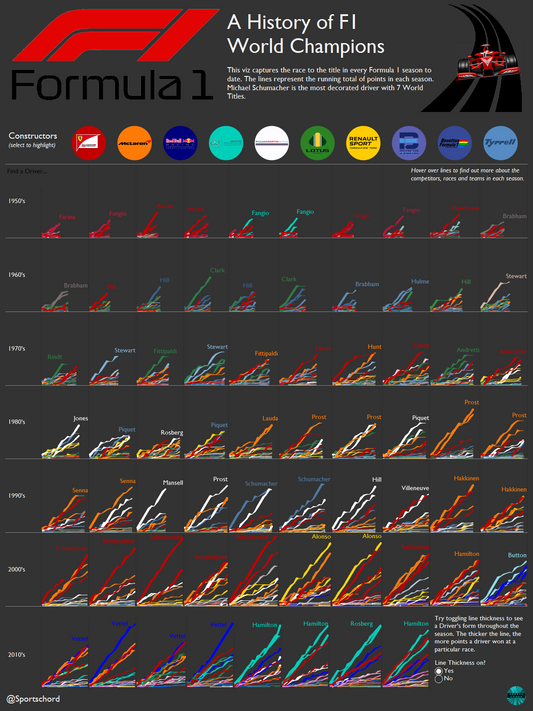
Formula 1 Project Part III – World champions This visualisation displays the race to the title in each of F1’s seasons to date. It does so by calculating the...
History of F1 World Champions
Formula 1 Project Part III – World champions This visualisation displays the race to the title in each of F1’s seasons to date. It does so by calculating the...
A History of Polar Area / Coxcomb / Rose charts...
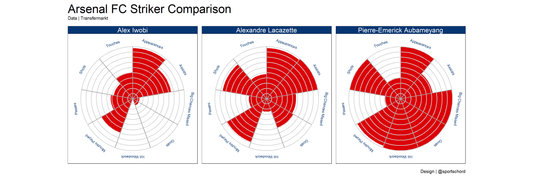
I've seen this chart referenced by several different names: Polar Area, Wind Rose, (just) Rose, Coxcomb, or even 'Consulants' chart. I'll start by outlining the history of the chart and...
A History of Polar Area / Coxcomb / Rose charts...
I've seen this chart referenced by several different names: Polar Area, Wind Rose, (just) Rose, Coxcomb, or even 'Consulants' chart. I'll start by outlining the history of the chart and...
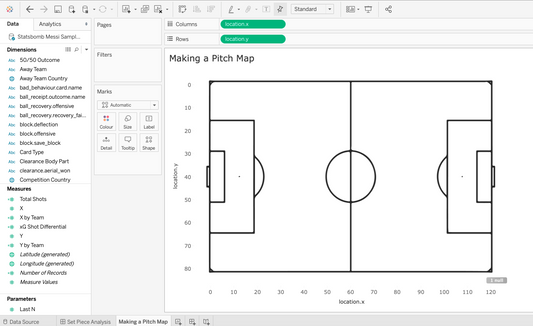
How to create Football Pitches/Goals as Backgro...
Analysing football data provides an excellent opportunity to use visual cues such as football pitch and goal frame outlines to help communicate visual analysis. 2D Football pitches have been...
How to create Football Pitches/Goals as Backgro...
Analysing football data provides an excellent opportunity to use visual cues such as football pitch and goal frame outlines to help communicate visual analysis. 2D Football pitches have been...
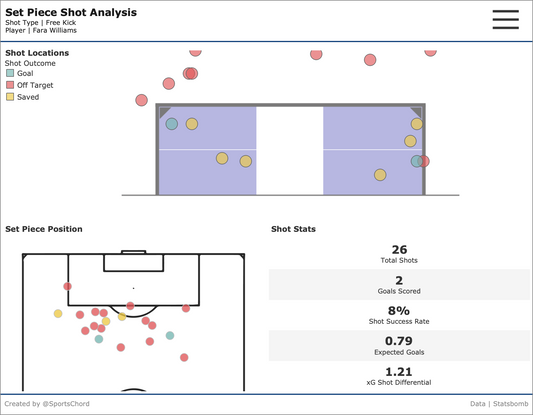
Visually Analysing Direct Set Pieces in Football
A review of working with Football data to analyse Free Kicks & Penalties using Tableau & R.
Visually Analysing Direct Set Pieces in Football
A review of working with Football data to analyse Free Kicks & Penalties using Tableau & R.